Views
The real (terms) story of historic water bills
Whoever you speak to, water bills are expected to go up from next year. Whether it’s the water companies in England and Wales, the economic regulator Ofwat, or environmental campaign groups – there is now widespread recognition of the need for higher bills to fund investment. They are necessary to deliver new legal requirements, respond to climate change and meet public and stakeholder expectations – though fortunately customers won’t pay for all of that investment upfront.
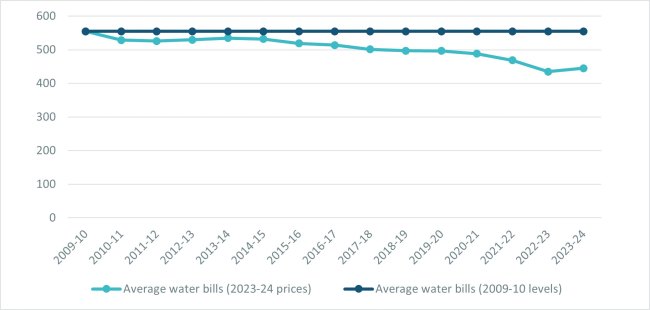
But taking a step back, it’s important to see those bill rises in context. Based on data from Ofwat, we can see how average bills have changed over recent years. And it shows that, remarkably, water bills have in fact decreased in real terms nearly every year since 2010.
Looking at bills or prices in ‘real’ terms means that we remove the effect of inflation, which is the average increase in prices across the whole economy. This means that we can more clearly compare the price of water for households over time, using one set of prices for every year.
Figure 1 – Average water and wastewater bills in real terms (£, 2023-24 prices)

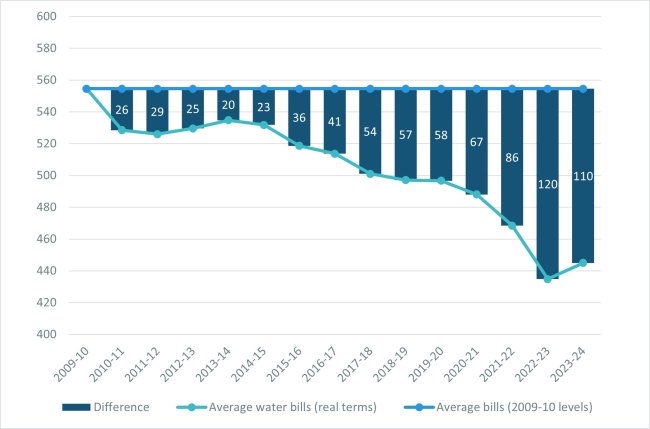
Based on this data, we estimate that had average water and wastewater bills simply kept pace with inflation since 2010, they would be £110 (or 25%) higher today. Over the 14 years since 2010, that’s an average saving of £750 for every household. To put that into context, added together for every single household in England and Wales that’s equivalent to £18 billion.
Figure 2 – Difference between average water and wastewater bills, and if bills had kept pace with inflation since 2009-10 (£, 2023-24 prices)

That means customers have paid lower bills than they otherwise could have. But with the benefit of hindsight, this arguably shows a missed opportunity for more investment. Additional money could have enabled the water sector to go much faster in reducing water leaks, eliminating sewage spills and building resilience to drought and extreme weather.
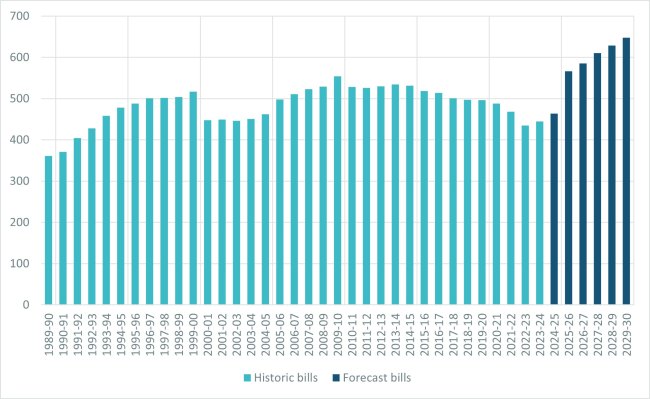
We should also consider the long-term picture. Going further back in time, we can see that while water bills increased substantially in the first decade or so after privatisation – largely to meet new legal environmental requirements and overcome the systemic underfunding under the previous water authorities – they are broadly at the same level today that they were in the early 2000s.
Figure 3 – Historic average water and wastewater bills from 1989-90 to 2023-24 and forecast average water and wastewater bills from 2025-30 (£, 2023-24 prices)

That’s not to say that future bill rises are meaningless. The bill rises being carefully weighed up by water companies and regulators will more than outstrip the decline in real bills in recent years. While some of those bill rises may help to overturn years of insufficient investment, the vast bulk of them will enable the water sector to go further than ever before – securing future water supplies, enabling economic growth, and ending sewage in our rivers and seas.
But we know that bill rises are never welcome. As well as new laws and tough regulations to ensure that water companies deliver what they say they will, households that are struggling to pay their bills can contact their water company for financial support, through social tariffs, payment breaks and a wide range of practical assistance for those that need it.
Update January 2025: the average bills dataset has been updated to reflect the latest figures for average bills as confirmed by Ofwat. Charts and figures in the blog have not been updated.


